Docker Provider Performance, 2026: Now Measured Every Night


TL;DR
macOS Docker provider performance has improved significantly over the years, and now all the providers seem to be performing about equivalently. So OrbStack, Docker Desktop, Lima, Colima, and Rancher Desktop are fast and working well.
Introduction
Back in November 2023 we published a hand-run comparison of macOS Docker providers. It was a snapshot: one laptop, one afternoon, one set of versions, and a Google Sheet. It answered the question people were asking, and then it started going stale the moment it was published.
That post is gone now, and this one replaces it, because the way we answer the question has changed. DDEV now runs the same benchmark battery every night, unattended, on every platform and Docker provider we support, and publishes the accumulated history.
Table of Contents
- Where to see the numbers
- Which metric to compare
- macOS results
- The other platforms, and why you shouldn’t rank them against macOS
- Getting the raw data
- Running it on your own machine
- Summary
Where to see the numbers
The nightly results live at the DDEV performance history dashboard.
The easiest way to find it (and everything else the DDEV GitHub organization publishes) is to start at github.com/ddev/ddev.github.io and follow the “Performance History” link. That repo’s README is the index of DDEV’s GitHub Pages sites — bookmark it and you don’t have to remember any of the other URLs.
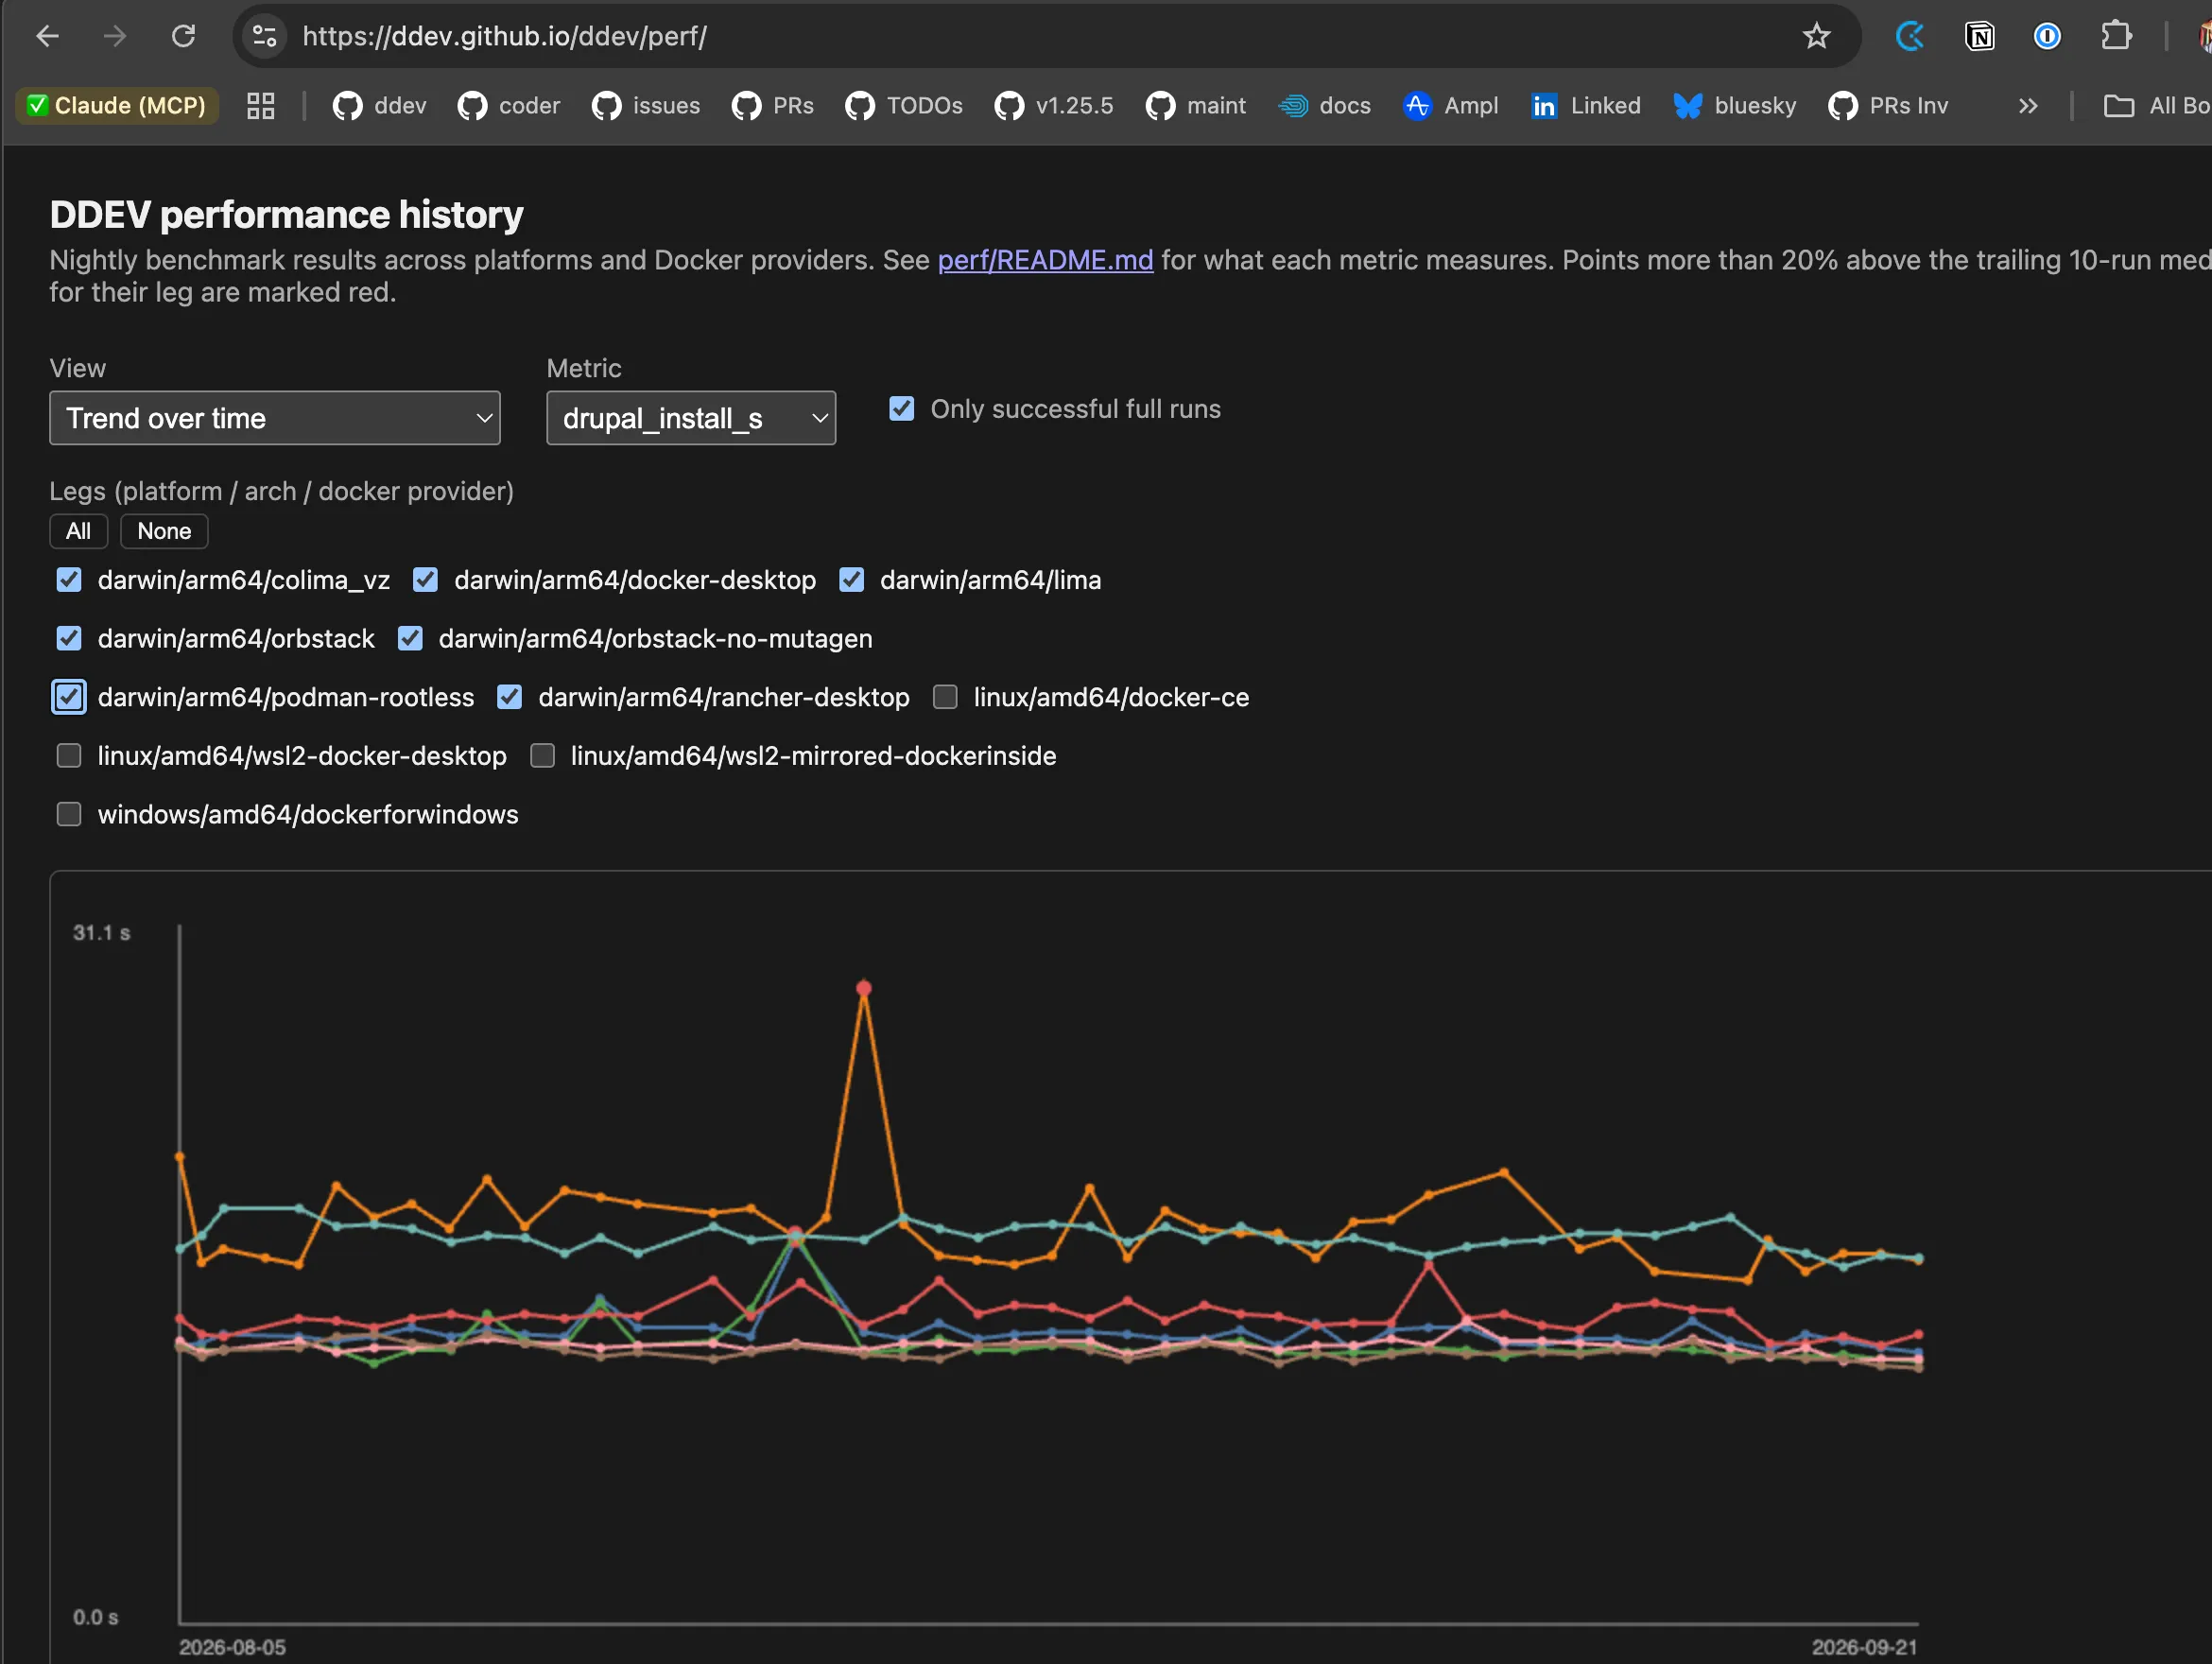
The dashboard has two views. Trend over time plots one line per leg so you can see regressions and improvements as they land. Compare environments (latest) gives you a sorted bar chart of each environment’s recent median, which is the view that most directly replaces the 2023 post’s charts.
Which metric to compare
The harness collects six metrics per run. The one that lines up with the 2023 post is drupal_install_s: Puppeteer drives the Drupal web install wizard end-to-end, in a real browser, through the DDEV router, the web server, and PHP-FPM.
I think it’s important that it uses a web-intensive install process for studying web server performance. The interactive installer deliberately breaks each batch step into its own HTTP request and page reload, so every one of those round trips exercises exactly the layer where Docker provider differences show up — bind mount vs. Mutagen, gRPC-FUSE vs. virtiofs, and so on. It’s the closest thing in the suite to “what does it feel like to actually use this.”
The companion metric drush_install_s runs the same install non-interactively via ddev drush si, which never touches the router or web server at all. If the two track together, filesystem I/O dominates; if they diverge, the gap isolates router/web server overhead. The perf/README.md describes all six metrics and why each one is there.
macOS results
Medians of the nightly runs from 2026-08-31 through 2026-09-30, drupal_install_s in seconds, fastest first. All legs are Apple Silicon (ARM64), all with Mutagen enabled except where noted.
| Docker provider | drupal_install_s | drush_install_s | ddev_start_cold_s |
|---|---|---|---|
| Rancher Desktop | 12.0 | 9.8 | 16.5 |
| Lima | 12.1 | 9.9 | 15.8 |
| Podman (rootless) | 12.3 | 9.9 | 46.0 |
| Colima (vz) | 12.6 | 10.0 | 14.4 |
| OrbStack | 13.4 | 10.4 | 12.2 |
| Docker Desktop | 16.7 | 13.4 | 21.0 |
| OrbStack, no Mutagen | 16.8 | 11.2 | 9.2 |
The headline is how boring this table is. Five of the six Mutagen-enabled macOS providers land within 1.4 seconds of each other on the flagship metric, and their drush_install_s numbers are within 0.6 seconds. On macOS with Mutagen, your choice of Docker provider is mostly not a performance decision anymore. Pick based on licensing, maintenance, and how the tool fits your workflow.
That is a significant change from 2023, when OrbStack was clearly ahead and Colima and Rancher Desktop looked sluggish. Those gaps have largely closed (all are now using VZ/VirtioFS).
Compared with the 2023 numbers
The 2023 test did a Drupal 10 web install with Mutagen and got OrbStack 20s, Docker Desktop 22s, Rancher Desktop 22s, Colima QEMU 33s, and Colima VZ 35s. The fastest then (OrbStack, 20s) compares with 12.0s for the fastest now (Rancher Desktop), and with 13.4s for OrbStack. The slowest providers gained the most: Rancher Desktop went from 22s to 12.0s and Colima VZ from 35s to 12.6s. The spread between providers went from 15 seconds to about 1.4 (excluding Docker Desktop).
Treat these as a rough comparison, not a like-for-like benchmark. The 2023 numbers came from one MacBook Air M1 (2020) on a single afternoon, with DDEV v1.22.5, Drupal 10.1.6, and PHP 8.1. The nightly runs use CI runner machines, and newer DDEV, Drupal, and PHP versions. Both tests drive the demo_umami install through Puppeteer. Each Docker provider has also shipped many releases since 2023, and the Colima leg now uses VZ where one of the 2023 legs used QEMU with sshfs. Some of the improvement comes from the hardware, and some from the software.
When DDEV was young, a web install with Docker Desktop took SEVEN MINUTES. You’d just watch it poke along at each section. Now you don’t even see those as they flash by. Now it takes 12-17 seconds. That’s progress!
Mutagen is still doing the work
The most interesting row is the last one. OrbStack with Mutagen finishes the browser install in 13.4s; the same provider without Mutagen takes 16.8s — about 25% slower. Note that the no-Mutagen leg is faster on ddev_start_cold_s (9.2s vs. 12.2s), because there’s no sync session to establish, and closer on drush_install_s (11.2s vs. 10.4s), because Drush never goes through the web server. The penalty concentrates in exactly the browser-driven path, which is what you use all day.
Mutagen is on by default on macOS for this reason, and these numbers say to leave it on.
However, plenty of people are perfectly happy with turning off Mutagen. Some folks don’t like the additional complexity and don’t want the speed trade-off. ddev config global --performance-mode=none turns it off. (Mutagen has more benefits than just performance though; with Mutagen, the web server in the container is dealing with a Linux filesystem, more like the real deployment environment, instead of a Docker bind-mount, which is more like a network filesystem.)
Read the hardware caveat before comparing rows
The Docker Desktop leg runs on older M1 test runner machines that have dedicated hardware. OrbStack, Rancher Desktop, Colima, Lima, and Podman share a pool of newer machines. Some of the Docker Desktop gap in the table above is that hardware difference, not the provider. We didn’t normalize it — the dashboard deliberately doesn’t either — so treat Docker Desktop’s row as “somewhat pessimistic” rather than as a clean like-for-like comparison.
The other platforms, and why you shouldn’t rank them against macOS
The dashboard also carries Linux, WSL2, and traditional Windows legs. They’re useful for spotting regressions within a leg over time, but the cross-platform bar chart is misleading if you read it as a platform ranking:
- The Linux leg runs on ephemeral GitHub-hosted runner VMs. It provisions the Drupal codebase from scratch every night and starts with cold image, Composer, and OS page caches. Every macOS and Windows leg reuses a persistent codebase and warm caches.
- The Windows and WSL2 legs run on entirely different physical hardware from the macOS test runners.
Trends within a leg: meaningful. Bar-chart comparisons across legs: only meaningful when the machines are comparable, which across platforms they aren’t.
Getting the raw data
Every chart on the dashboard has a Download CSV button that exports exactly the rows behind whatever is currently displayed — after your leg and metric selections, not the whole dataset. That’s the quickest path to your own analysis.
If you want everything, the underlying dataset is one JSON object per line at history.ndjson, with one line per (commit, leg) benchmark run:
curl -sL https://ddev.github.io/ddev/perf/history.ndjson |
  jq -r 'select(.os=="darwin") | [.timestamp, .docker_provider, .metrics.drupal_install_s] | @tsv'
Running it on your own machine
The harness that replaced the old ddev-puppeteer script lives in the DDEV repository and runs locally against a standard DDEV Drupal project:
./perf/run-benchmark.sh \
  --project-dir ~/workspace/d11 \
  --site-url https://d11.ddev.site/ \
  > result.json
It needs jq and Node.js on your PATH in addition to the usual DDEV prerequisites. If your numbers look very different from the nightly legs, we’d like to hear about it.
Summary
Three years ago the answer to “which Docker provider is fastest on macOS?” was worth a blog post with charts. Today the simple answer is that, with Mutagen on, they’re close enough that the question is mostly settled, and any lingering differences are small next to the hardware you’re running on.
What’s better than a fresh answer is a standing one. The nightly harness means the next time performance shifts — a provider regression, a Mutagen improvement, a DDEV build-layer mistake — it shows up on the dashboard within a day, instead of waiting for somebody to run the numbers by hand and write another post.
Have questions, or numbers that look different from the dashboard? Join the conversation in our Discord, open an issue, or reach out via email.
Follow our blog, Bluesky, LinkedIn, Mastodon, and join us on Discord. Sign up for the monthly newsletter.
This article was edited and refined with assistance from Claude Code.