XHGui Feature Makes Profiling Even Easier

XHGui Lands in DDEV v1.24.4
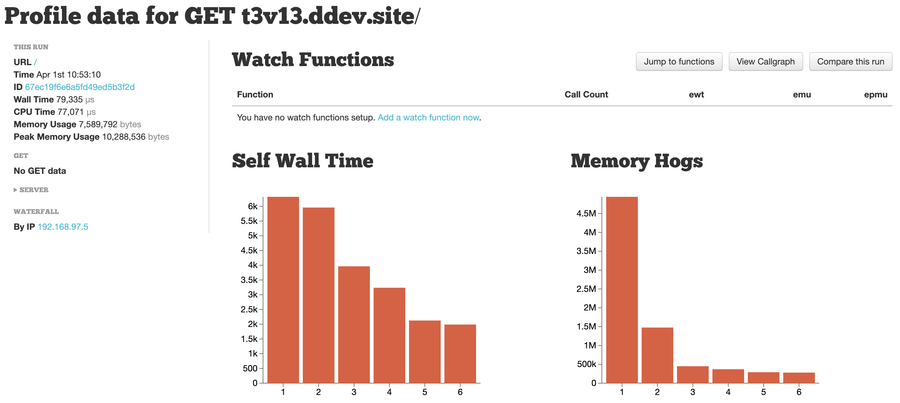
Thanks to sponsorship from the TYPO3 Community Budget Ideas, DDEV now includes XHGui support for its XHProf profiling. This brings a much-improved experience with a consistent, browser-based interface.
DDEV has had XHProf profiling for some time, and many in the community have loved it, but it had a few flaws; the list of profiling runs was ugly and uncoordinated, and the list was lost on ddev restart.
However, the longstanding XHGui project was out there for years, and it made much more sense.
With XHGui, you can now track performance bottlenecks with a clean interface, persistent data, and detailed breakdowns of CPU and memory usage.
How to Use XHGui for Profiling
In DDEV v1.24.4+ you can switch to the XHGui profiling mode (permanently) with
ddev config global --xhprof-mode=xhgui && ddev restartStart profiling with
ddev xhgui onVisit a few pages in your app to collect profiling data, then
ddev xhgui launchIn general, click one of the GET or POST links and follow it in to explore detailed CPU and memory usage breakdowns.
If you have questions, join us in one of the DDEV support venues, especially Discord and we’ll work it through with you.
The DDEV Docs on XHProf have some good starters, but your suggestions are welcome!
XHGui Demonstration Screencast
Here’s a quick demonstration of using XHGui with a TYPO3 site in DDEV.
Thanks to TYPO3, glensc, and tyler36
Serious thanks are due to:
- The TYPO3 Organization for funding this feature integration.
- Elan Ruusamäe (glensc) for years of maintaining the XHGui project (and extreme responsiveness as we worked on this).
- DDEV community member tyler36, who created the original DDEV add-on and helped it incubate and mature over years and supported its inclusion in DDEV core.
Support
Try it out today and let us know how it goes — your feedback helps shape the future of DDEV! Join us in the DDEV support venues if you want to talk about XHGui and profiling.