Xdebug in DDEV: Understanding, Debugging, and Troubleshooting Step Debugging

For most people, Xdebug step debugging in DDEV just works: ddev xdebug on, set a breakpoint, start your IDE’s debug listener, and go. DDEV handles all the Docker networking automatically. If you’re having trouble, run ddev utility xdebug-diagnose and ddev utility xdebug-diagnose --interactive — they check your configuration and connectivity and tells you exactly what to fix.
This post explains how the pieces fit together and what to do if things do go wrong.
The Quick Version
ddev xdebug on- Start listening in your IDE (PhpStorm: click the phone icon; VS Code: press F5)
- Set a breakpoint in your entry point (
index.phporweb/index.php) - Visit your site
If it doesn’t work:
ddev utility xdebug-diagnoseOr for guided, step-by-step troubleshooting:
ddev utility xdebug-diagnose --interactiveThe diagnostic checks port 9003 listener status, host.docker.internal resolution, WSL2 configuration, xdebug_ide_location, network connectivity, and whether Xdebug is loaded. It gives actionable fix recommendations.
How Xdebug Works
Xdebug lets you set breakpoints, step through code, and inspect variables — interactive debugging instead of var_dump().
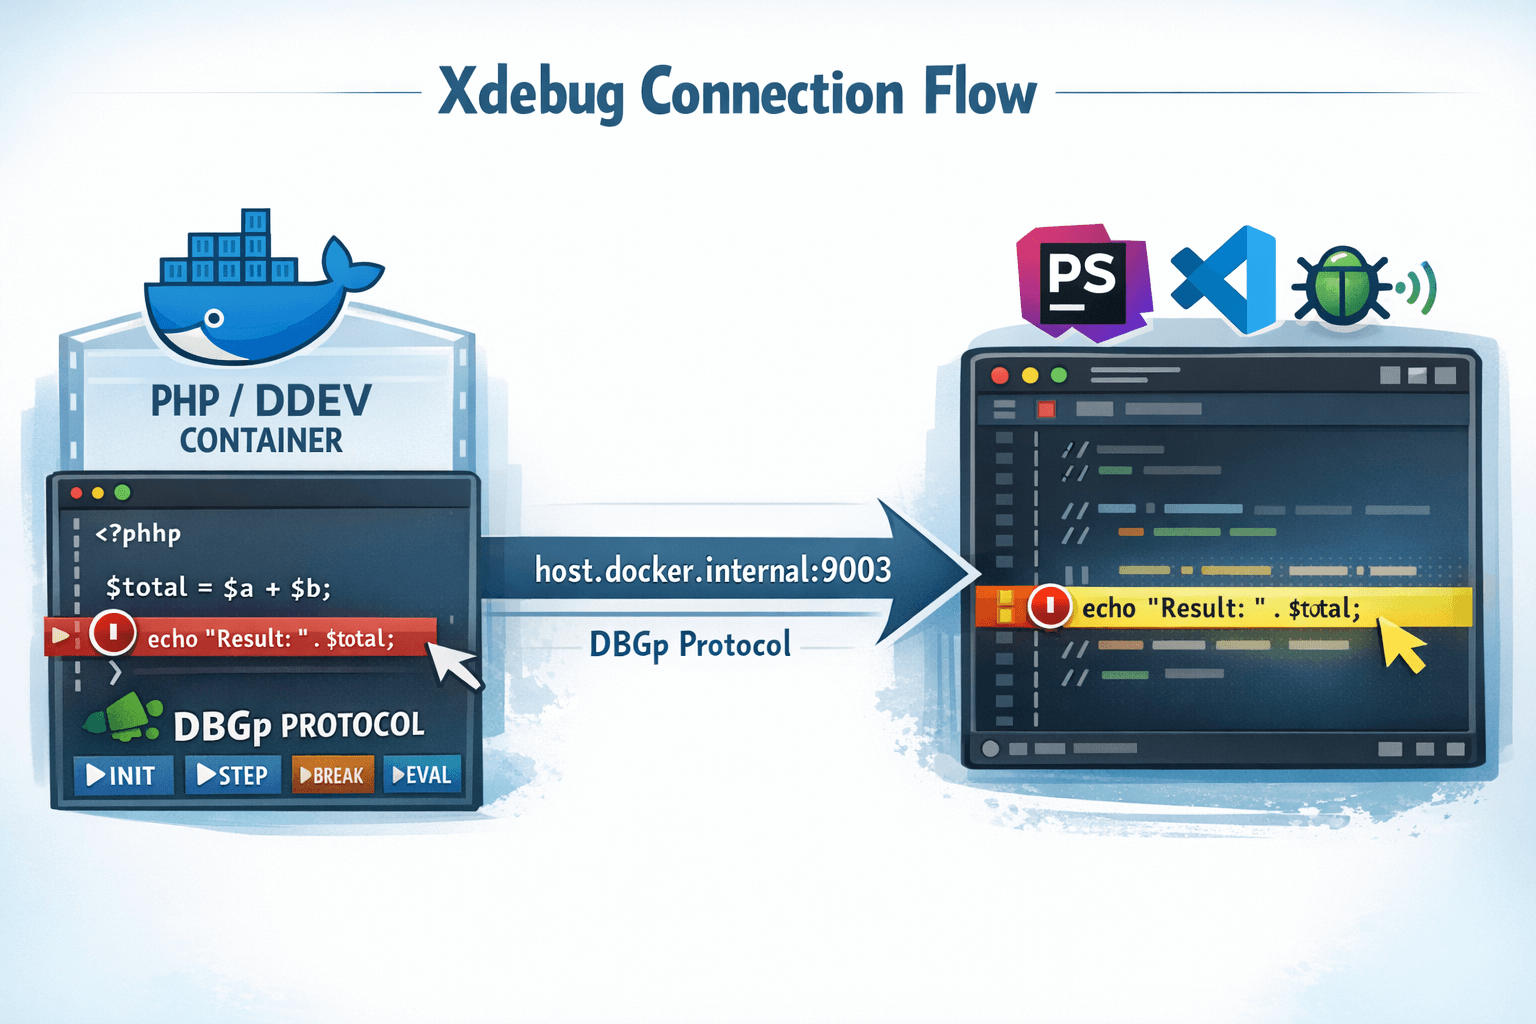
The connection model is a reverse connection: your IDE listens on port 9003 (it’s the TCP server), and PHP with Xdebug initiates the connection (it’s the TCP client). Your IDE must be listening before PHP tries to connect.
The Xdebug documentation uses the opposite terminology, calling the IDE the “client.” We use standard TCP terminology here.
How DDEV Makes It Work
DDEV configures Xdebug to connect to host.docker.internal:9003. This special hostname resolves to the host machine’s IP address from inside the container, so PHP can reach your IDE across the Docker boundary.
The tricky part is that host.docker.internal works differently across platforms. DDEV handles this automatically:
- macOS/Windows: Docker Desktop and Colima provide
host.docker.internalnatively - Linux: DDEV uses the docker-compose host gateway feature
- WSL2: DDEV determines the correct IP based on your configuration
You can verify the resolution with:
ddev exec getent hosts host.docker.internalDDEV Xdebug Commands
ddev xdebug on/off/toggle— Enable, disable, or toggle Xdebugddev xdebug status— Check if Xdebug is enabledddev xdebug info— Show configuration and connection details
IDE Setup
PhpStorm
Zero-configuration debugging works out of the box:
- Run → Start Listening for PHP Debug Connections
- Set a breakpoint
- Visit your site
PhpStorm auto-detects the server and path mappings. If mappings are wrong, check Settings → PHP → Servers and verify /var/www/html maps to your project root.
The PhpStorm DDEV Integration plugin handles this automatically.
VS Code
Install the PHP Debug extension and create .vscode/launch.json:
{
  "version": "0.2.0",
  "configurations": [
    {
      "name": "Listen for Xdebug",
      "type": "php",
      "request": "launch",
      "port": 9003,
      "hostname": "0.0.0.0",
      "pathMappings": {
        "/var/www/html": "${workspaceFolder}"
      }
    }
  ]
}
The VS Code DDEV Manager extension can set this up for you.
WSL2 + VS Code with WSL extension: Install the PHP Debug extension in WSL, not Windows.
Common Issues
Most problems fall into a few categories. The ddev utility xdebug-diagnose tool checks for all of these automatically.
Breakpoint in code that doesn’t execute: The #1 issue. Start with a breakpoint in your entry point (index.php) to confirm Xdebug works, then move to the code you actually want to debug.
IDE not listening: Make sure you’ve started the debug listener. PhpStorm: click the phone icon. VS Code: press F5.
Incorrect path mappings: Xdebug reports container paths (/var/www/html), and your IDE needs to map them to your local project. PhpStorm usually auto-detects this; VS Code needs the pathMappings in launch.json.
Firewall blocking the connection: Especially common on WSL2, where Windows Defender Firewall blocks connections from the Docker container. Quick test: temporarily disable your firewall. If debugging works, add a firewall rule for port 9003.
WSL2 Notes
WSL2 adds networking complexity. The most common problems:
-
Windows Defender Firewall blocks connections from WSL2 to Windows. Temporarily disable it to test; if debugging works, add a rule for port 9003.
-
Mirrored mode requires
hostAddressLoopback=trueinC:\Users\<username>\.wslconfig:[experimental] hostAddressLoopback=trueThen
wsl --shutdownto apply. -
IDE in WSL2 (VS Code + WSL extension): Set
ddev config global --xdebug-ide-location=wsl2
Special Cases
Container-based IDEs (VS Code Remote Containers, JetBrains Gateway):
ddev config global --xdebug-ide-location=containerCommand-line debugging: Works the same way — ddev xdebug on, start your IDE listener, then ddev exec php myscript.php. Works for Drush, WP-CLI, Artisan, and any PHP executed in the container.
Debugging Composer: Composer disables Xdebug by default. Override with:
ddev exec COMPOSER_ALLOW_XDEBUG=1 composer installCustom port: Create .ddev/php/xdebug_client_port.ini with xdebug.client_port=9000 (rarely needed).
Debugging host.docker.internal resolution: Run DDEV_DEBUG=true ddev start to see how DDEV determines the IP.
Advanced Features
xdebugctl: DDEV includes the xdebugctl utility for dynamically querying and modifying Xdebug settings, switching modes (debug, profile, trace), and more. Run ddev exec xdebugctl --help. See the xdebugctl documentation.
Xdebug map feature: Recent Xdebug versions can remap file paths during debugging, useful when container paths don’t match local paths in complex ways. This complements IDE path mappings.
Performance: Xdebug adds overhead. Use ddev xdebug off or ddev xdebug toggle when you’re not actively debugging.
More Information
Claude Code was used to create an initial draft for this blog, and for subsequent reviews.